Filtering
Summary
You can use different standardized filtering to help you interpret your data.
It will help you to:
Visualize data better, especially when you are dealing with many entries, events, and so on.
Focus on a useful Metric or Dimension.
Apply data or results to your business decision-making processes.
Three new filters have been added for quicker access to the most commonly searched dimensions:
Title
Content ID
Channel
Basic dashboard filtering
The Overview Dashboard offer quick filtering buttons that run along the top of the pre-established dashboards.
![]()
Simply click a button to apply it to the dashboard data.
Advanced dashboard filtering
Most both pre-established areas offer an advanced filter bar with a time range, time compare, granularity, dimensions and metrics options.
![]()
Access
You can find the Advanced filtering box through the pre-defined dashboard found in the side navigation bar.
From the top filter bar, click on the three-line triangular icon. You will then see the tabs for dimensions, metrics and tops tabs.
More information can be found on this page.
Advanced filter tabs
n the advanced filter tabs, you can create and apply filters for dimensions and metrics.
You can also easily access saved filters.
More information about dimensions and metrics can be found here.
How to use
Dimension
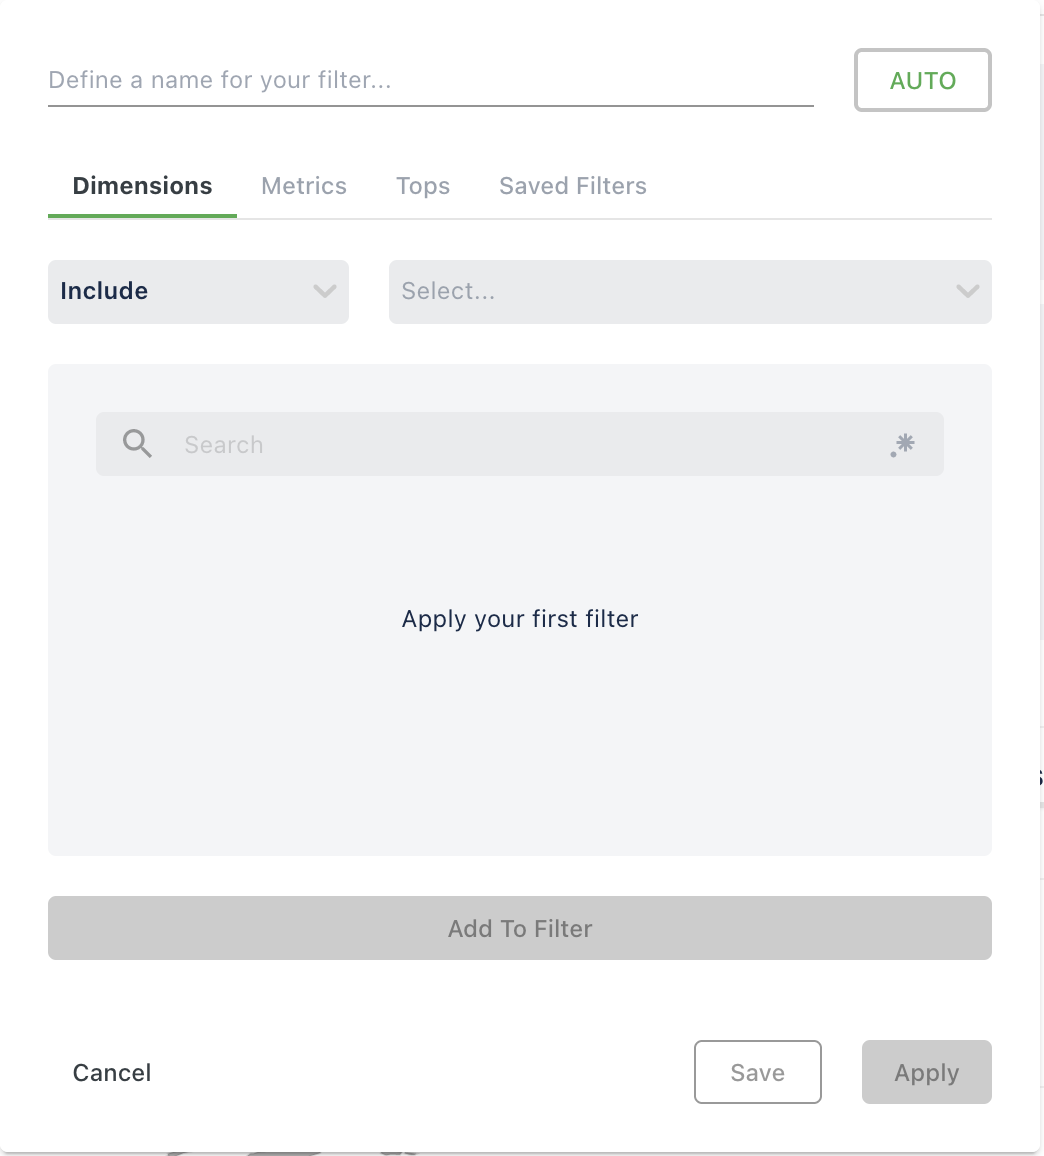
Click the advanced filter icon (represented by the triangle icon) to open the advanced filter tabs.
You will then see the tabs for dimensions, metrics, tops, and saved filters.
In the Dimensions tab, you can use a drop-down field to include, exclude or split the desired dimension:
If you want to filter out specific data from your current dataset, you can exclude the dimension, such as Country>United Kingdom.
If you want to include specific data in the currently displayed dataset, you can include the dimension, such as Country>United Kingdom.
To compare two dimensions, you can split two dimensions, such as the Country>United Kingdom and Country>United States dimensions. The dashboard will then show the data from each country separately.
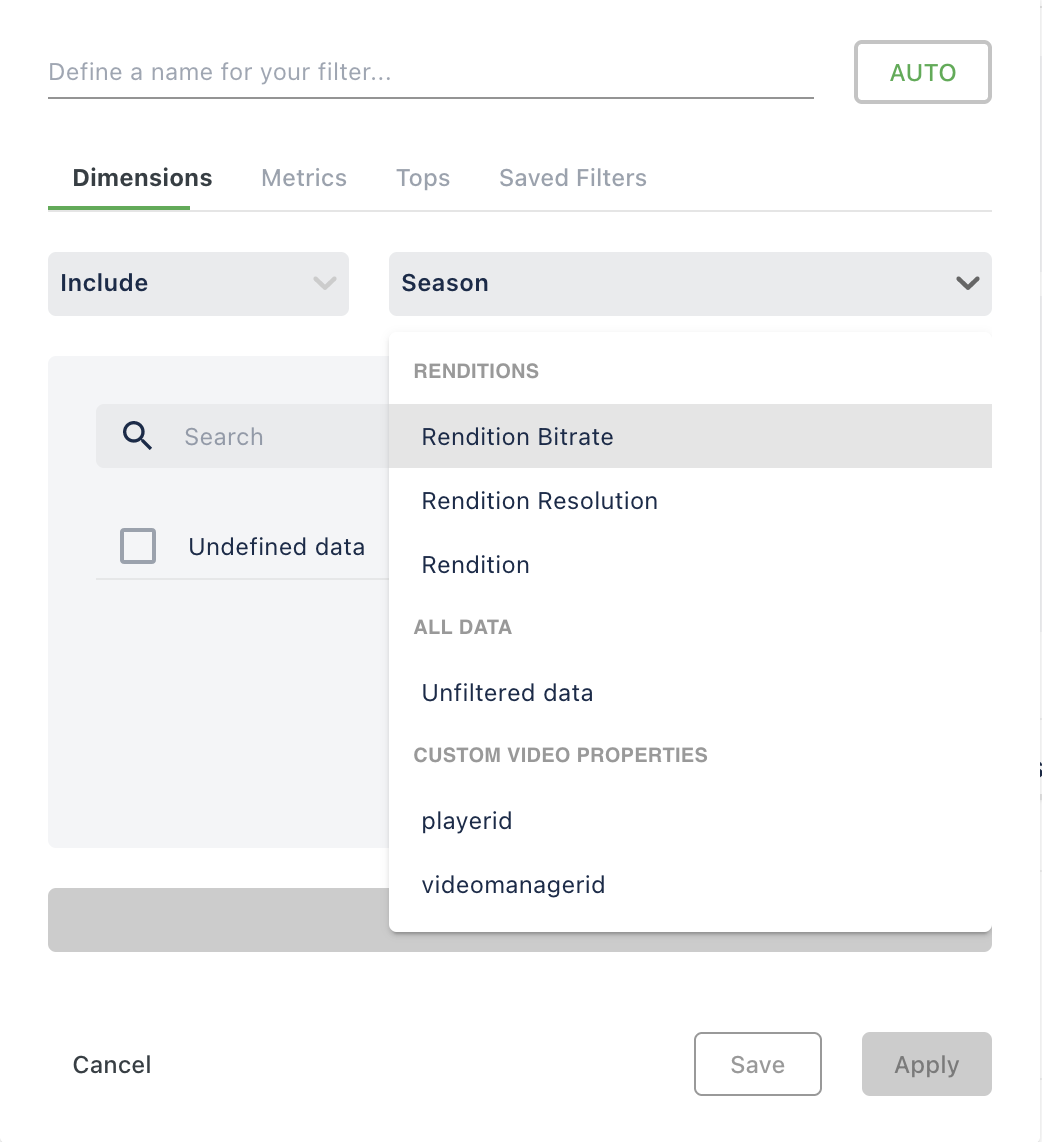
To create a filter for dimension, select a parameter:
After selecting the parameter, choose the desired predefined property and click "Add to Parameter":
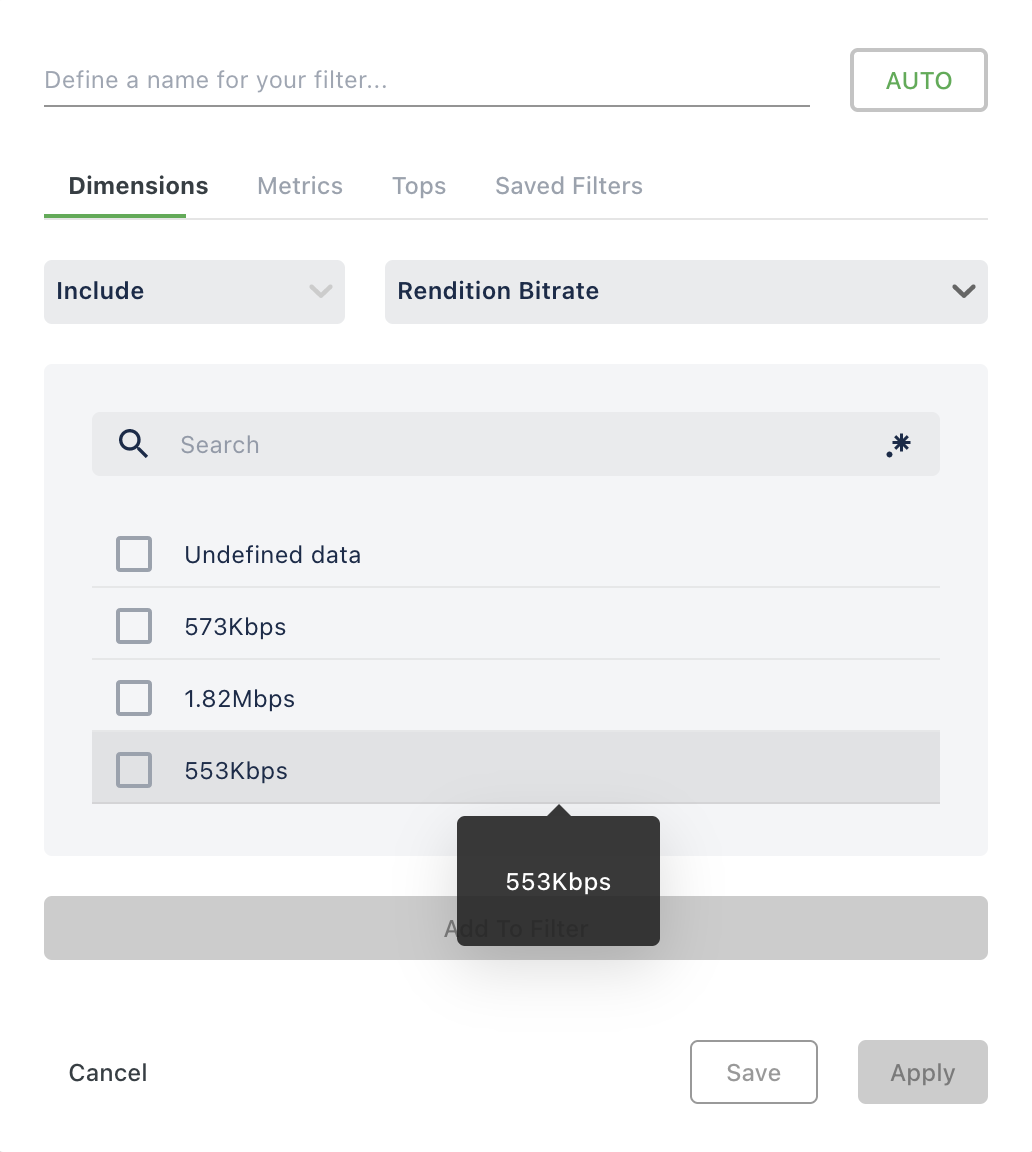
Apply the dimension.
Metrics
Begin with selecting a metric:
.png "image(93).png")
Now, select an operation:
.png "image(94).png")
Then, click "Add to Filter" and press "Apply".
Other filter
In addition to the metrics and dimensions tabs, there are also the Tops and Saved Filters tabs.
With the tops filter, you can view and filter data by rank.
Tops filter
To use the Tops filter, you must first create a widget:
Select the type of Top you want to create:
Top Table: The information in displayed in a table with the corresponding figures.
Top Bar: The information is displayed in bars with the corresponding data.
Top Pie: The information is displayed in a pie chart with the corresponding data.
Top Map: The information is displayed in a map with the corresponding data.
Once you have selected the type of graph, you can start configuring your top:
Specify the number of entries you want the top to show.
Specify how you want the data to be grouped by in the Group by drop-down menu.
Specify how you want the data to be sorted in the Sort by drop down menu.
Include the metrics that you want to apply to the top.
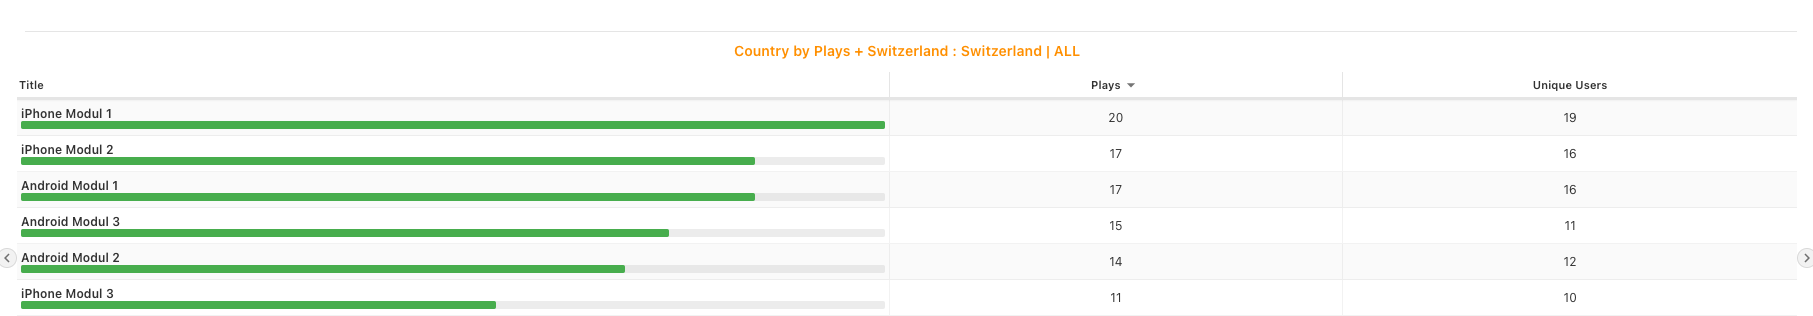
For instance, you can view the Top 5 titles and playtime to understand your content performance.
In this manner, you will know which of those titles present more errors:
Once you are done with entering the data you want to be displayed on the top, click Apply. You can also clone the widget and work on cloned copies by modifying its timespan, allowing you to see the improvement of your system’s error management.
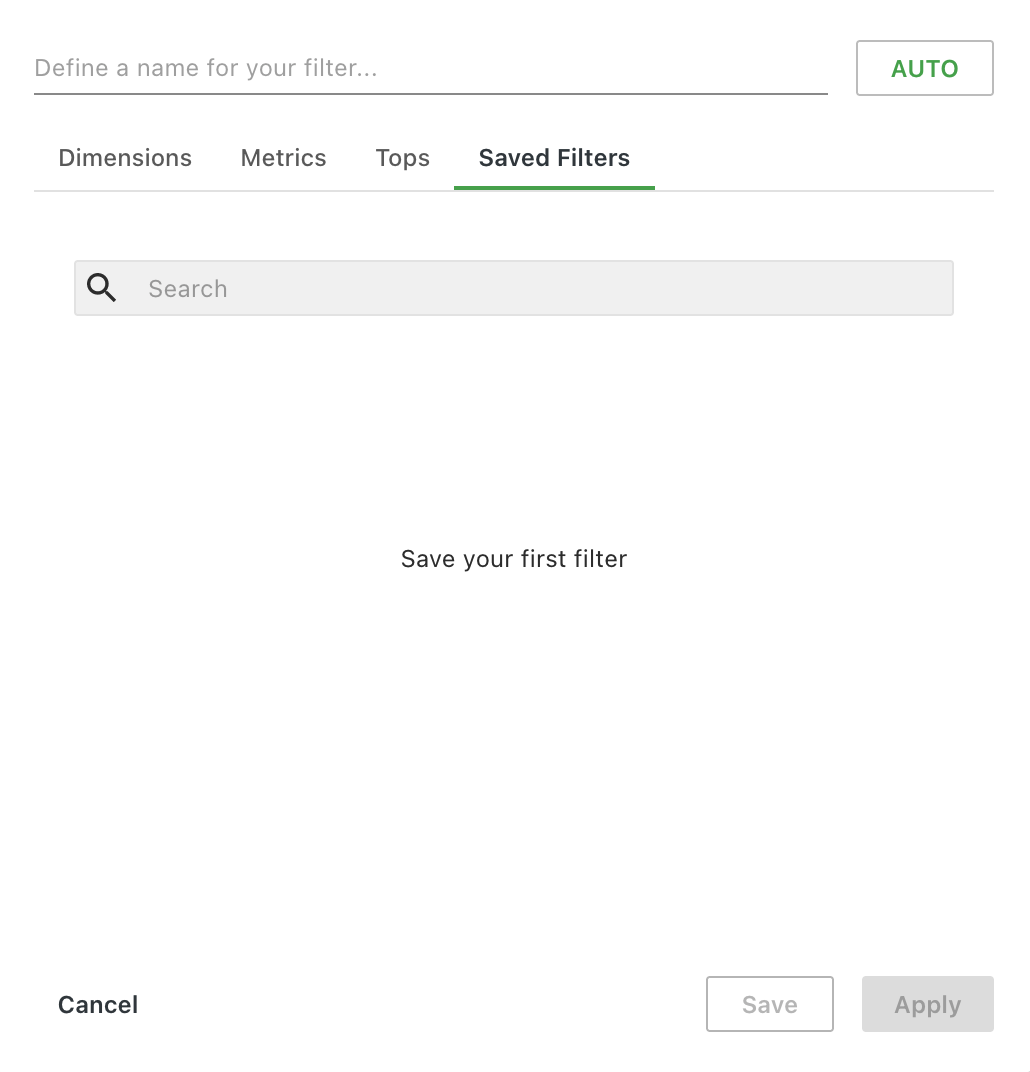
Saved Filters tab
The last available tab in the advanced filter bar is Saved Filters.
The Saved Filters tab lists the filter combinations you saved for future use. Simply click the Save button beside the Apply button to save new combinations.
Other filtering tools
Include, Exclude, Split
The Dimensions and Metrics tabs include a grouping drop-down field where you can apply to include, exclude or split the dimension or metric selected in the drop-down field to the right. What do these options provide?
.png "image(95).png")
How to apply include, exclude, split
Follow these general instructions to apply correctly:
Select the desired dimension or metric.
Choose include, exclude or split, as appropriate.
Click apply.
The label will appear at the bottom of the filter box.Continue to select and apply dimensions, metrics, tops, or samples.
Save, if reusable.
Free-form filtering
Users can enter "Free-Form" filtering options in My Dashboard areas to filter custom metrics, dimensions, and more. This new filter option means you are no longer restricted to existing values. Create your own values to fulfill your dimension filtering needs. Use these values strategically and group results or set up dashboards before launching new projects. With this feature you can:
Add any value in filters, not only predefined ones.
Write in any value not provided by the backend.
Apply Include, Exclude, and Split options to filtering.
How to access and use
Select the Video on Demand Dashboard from the My dashboards area on the main menu.
Click the filter icon and start typing in the desired value.
When it does not appear, enter a new value in the free-form field.
Save. This option now appears when filtering this specific dashboard.
.png "image(96).png")